▲ Case 01 · Monitoring of distributed assets
The alarm that learned to stay quiet
Monitoring solar plants is a matter of reading APIs. The hard problem is deciding when to speak, because an alarm that goes off every day gets switched off in the first week, and then nobody sees the day the problem was real.
- Period
- 2026
- My role
- concept, architecture and code
- Languages
- Python and JavaScript
- Status
- in daily operation
The problem
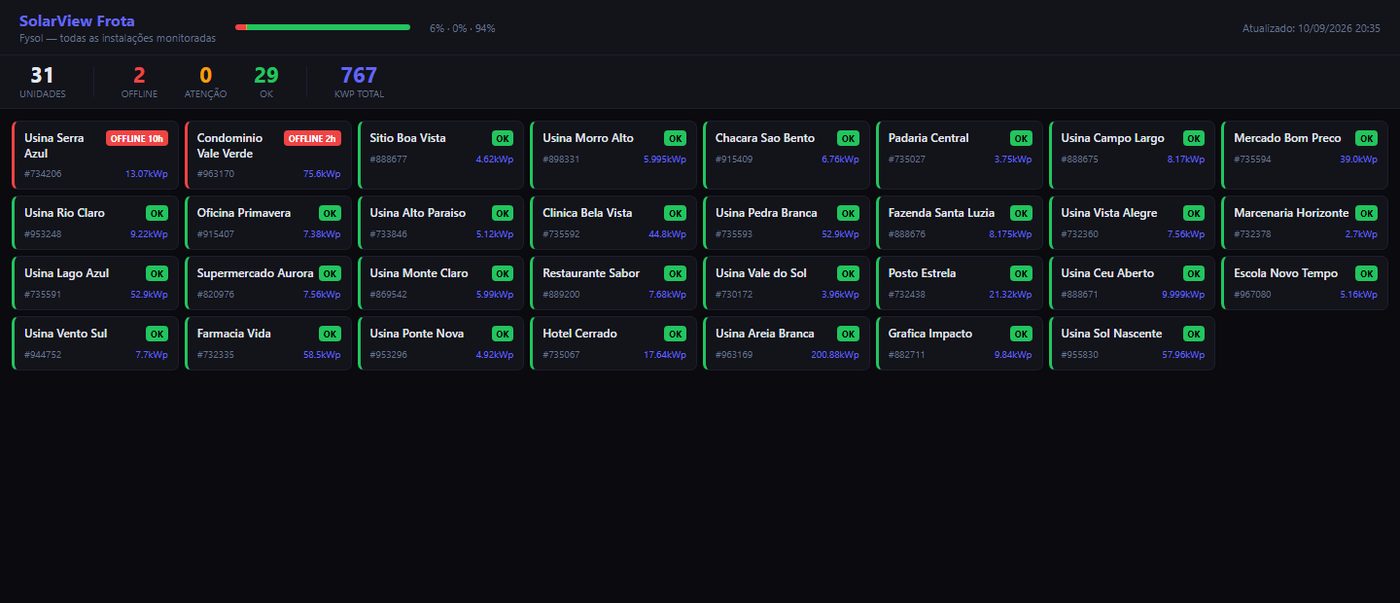
A solar plant that stops generating sends no signal at all. The owner finds out thirty days later, when the electricity bill comes in higher than it should, and there is no way to recover a month of generation that never happened.
The naive answer is to alert every time generation drops. It produces hundreds of alerts a month and gets none of them right: the inverter goes offline every night, and a cloudy day pulls down the generation of the whole fleet at the same time.
When the customer writes in
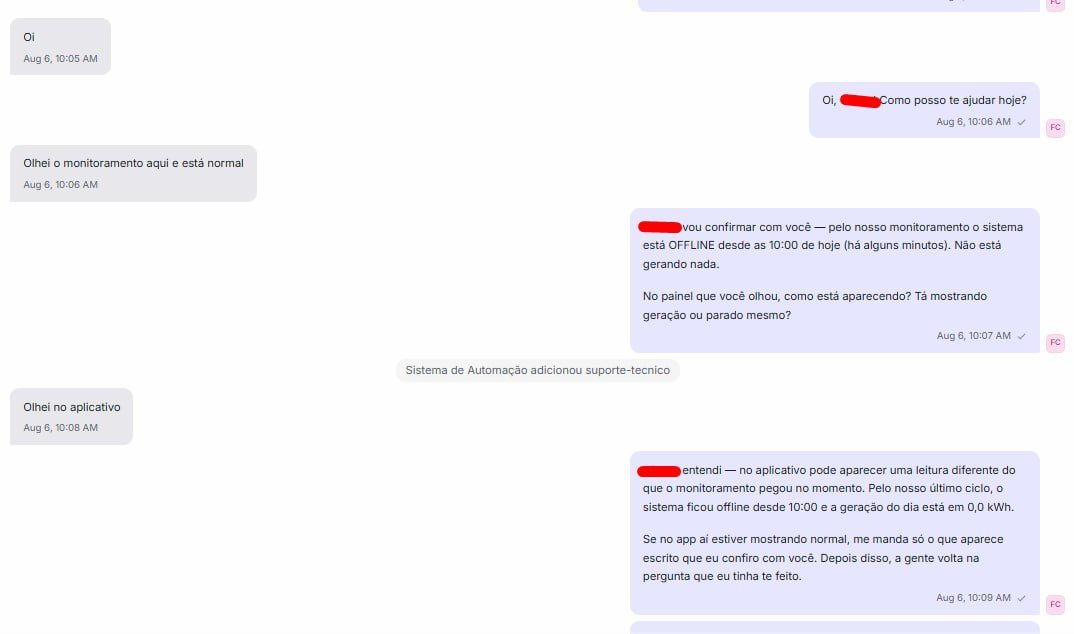
The plant owner talks to a bot on WhatsApp. The bot answers with the monitoring data, and not with what the customer thinks is happening. In the conversation below, the customer said everything was normal. The bot checked, showed the time the system stopped and turned the question back to the customer.
When the bot cannot solve it, it calls a person
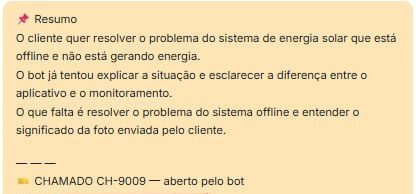
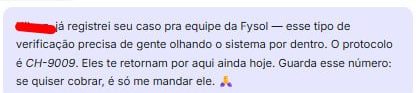
It writes the team a summary of the conversation, opens the ticket on its own and tells the customer the ticket number. Whoever takes over already knows what was said.
What it sends without being asked
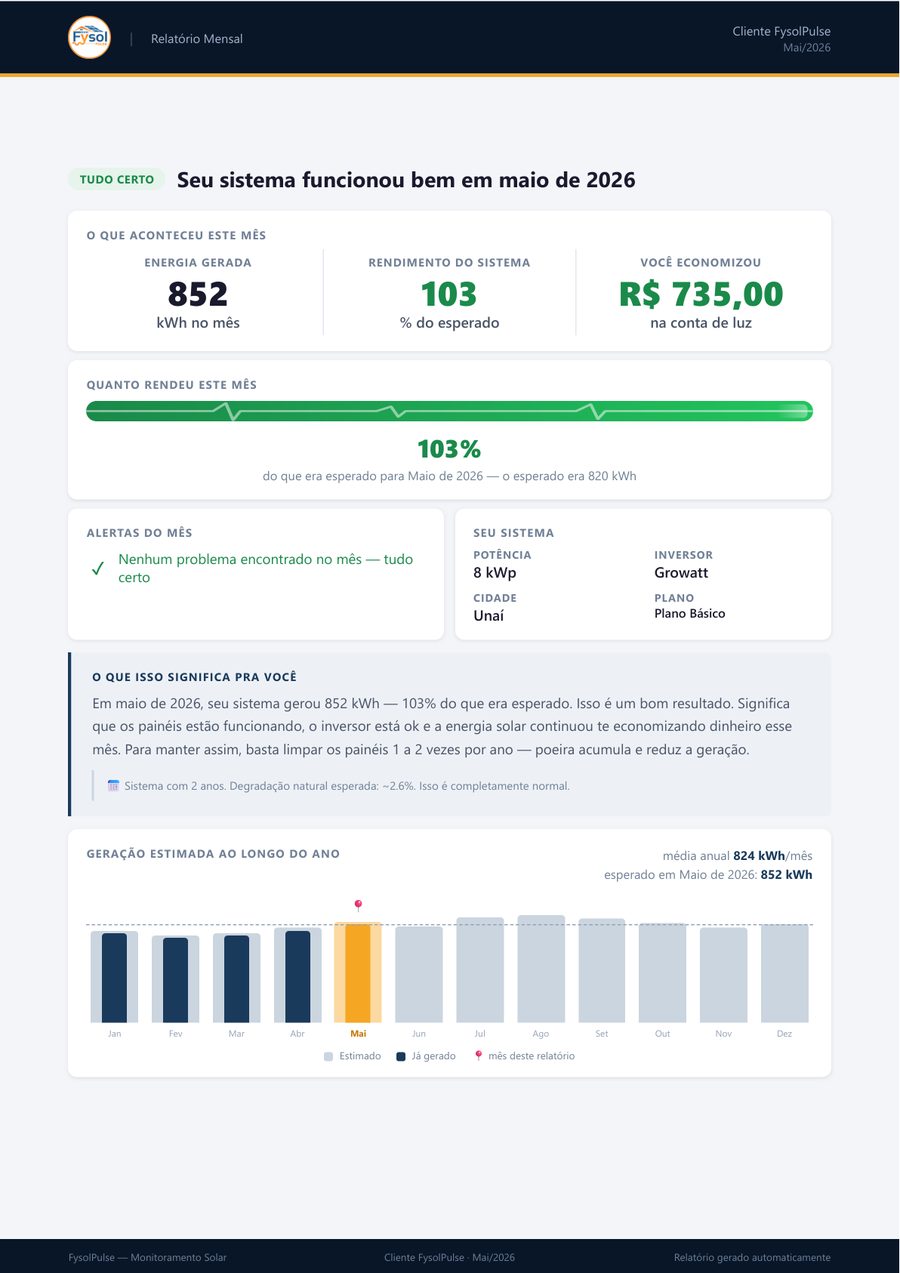
When the system stops during the day, the owner gets an alert listing what to check, in order. Every week, a summary of the generation. Every month, the report.
🔴 [name], your solar system stopped sending data [N] hours ago. Estimate: ~R$ [value] not generated ([N]h of production lost). What to check now: 1️⃣ Does your house have power? Turn on a light or the TV. • If there is no power, the grid may be down. The inverter comes back on its own. • If the power is normal, go to step 2. 2️⃣ Look at the inverter: is the screen on, or is there any light? 3️⃣ If everything looks normal and the alert continues, reply AJUDA (help) and I will check it with you. FysolPulse
☀️ [name] — weekly summary Your system generated [kWh] kWh last week ([date] to [date]). [the analysis of the week, written by the rule according to the result] 💰 Estimated savings: ~R$ [value] 📊 Performance: [%]% of expected FysolPulse · Solar Monitoring
How it is built
- Collection
- Python with
requestsagainst the inverter manufacturers' platforms. A proxy of my own normalizes the formats, because each manufacturer returns generation data in its own way. - Edge
- Six Cloudflare Workers in JavaScript.
- State and session
- Cloudflare KV. A session is a random 32-byte token in hexadecimal, with its own expiry.
- Passwords
- PBKDF2-SHA256 with 100,000 iterations and a 16-byte salt, through the runtime's native Web Crypto API. Constant-time comparison, so no information leaks through response time.
- Orchestration
- GitHub Actions routines: scheduled, triggered by external events and triggered by code changes. On top of them, a virtual server (VPS) runs the monitoring's scheduled routines on cron.
- Reports
reportlabfor the monthly PDF,holidaysfor the business-day calendar in the pro rata calculation,pycryptodomefor what travels encrypted.- Billing
- Asaas webhook, where the payment-confirmed event promotes the customer from trial to subscriber with no human intervention.
- Tests
- Automated tests running on every change, through the same mechanism that publishes.
The decisions, and what I ruled out in each one
Never alert the obvious
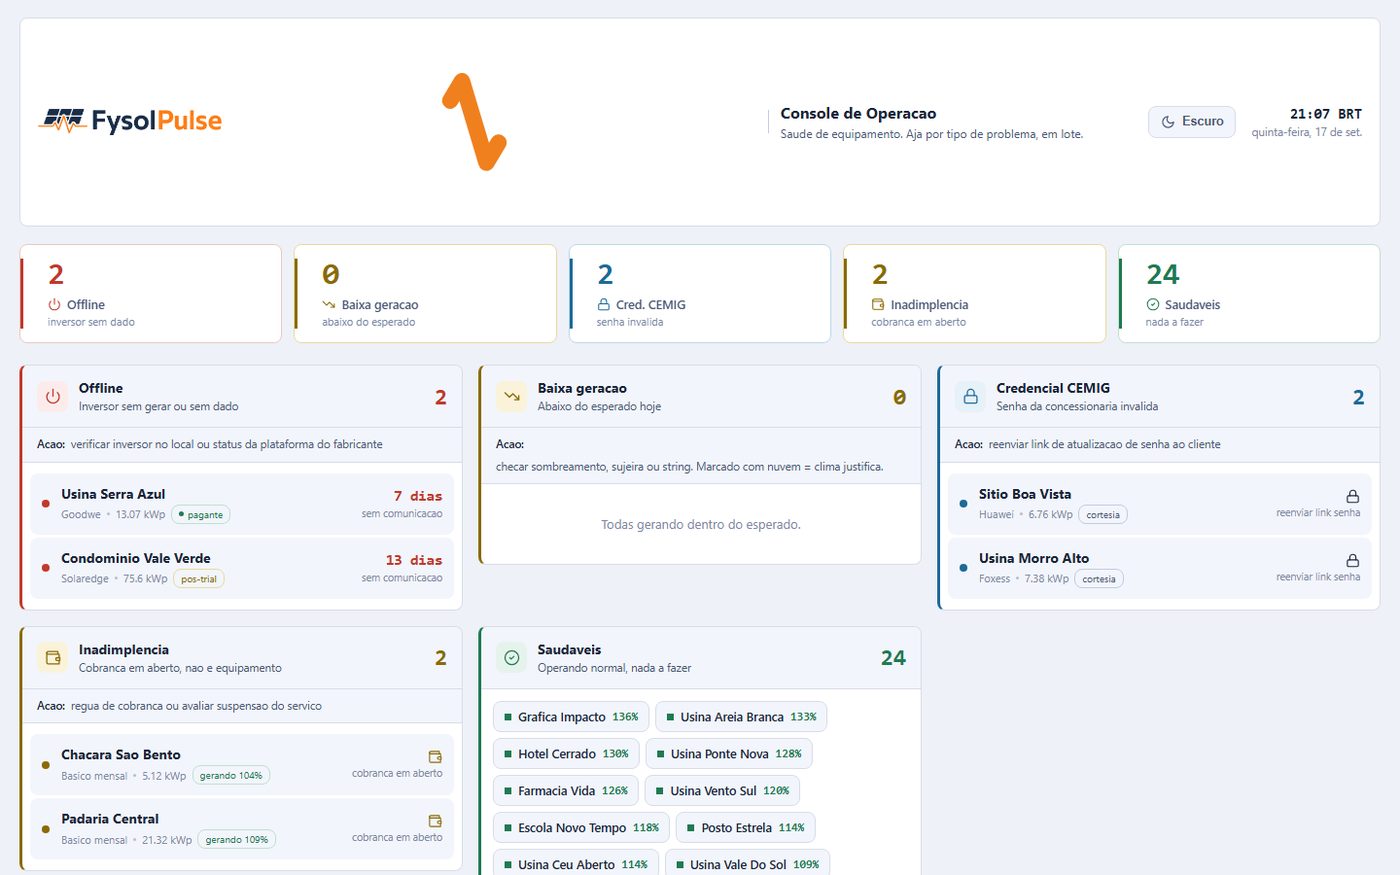
The system checks a table of conditions before it says anything. Offline during the day for more than thirty minutes becomes an alert. Offline at night is silence, because there is no sun. Recovery at sunrise is silence, because that is the sun coming up and not a recovery. Generation below seventy percent of expected only alerts if it persists for three hours in full daylight.
What I ruled out: a single generation threshold, which is the one-line-of-code route. It would have fired every day at dusk and on every cloudy day.
Some of the rules in that table exist so the system does not speak.
Weather goes into the classification, not into the report
Before classifying a drop as a failure, the system compares the day's generation with what is expected for that installed capacity in that location, and checks the weather conditions. When the sky explains the drop, the event is marked as weather and leaves the work queue. When it does not, it goes up with the technical action already written next to it.
What I ruled out: showing the weather data in the report and letting the person draw the conclusion. That hands the judgment to whoever has the least context and the most hurry.
When collection stopped, the problem was not where everyone looks
One of the sources started refusing the server's calls. The natural suspicion falls on the source address, and the natural fix is to change the address or pay for an intermediary. The diagnosis pointed to a different layer.
What I ruled out: paying for outbound traffic through an intermediary, which costs money every month, hides the cause and pushes the problem to the following month.
The test isolated the variable: same origin, same minute, changing only the suspect layer. Before, no call went through. After, all of them did. And the alternative route stays in the code, in case the fix stops working.
The language layer falls back in a cascade, and not into silence
Customer support uses a language model in two separate roles, classifying and writing, and each role has its own chain of attempts: the main provider with the first key, the same provider with a second key when the daily quota runs out, and finally a different provider, paid and with no quota.
The whole chain is configured by environment variables. Without the variables for the last level, the behavior is identical to what it was before, which let me ship the change before deciding to turn it on.
What I ruled out: a single key from a single provider. When the daily quota ran out, the system had nowhere to go: it either fell straight onto the expensive model or went silent in the middle of a conversation.
The trap that only shows up when you implement it: each model family accepts different parameters, and some reject with an error what another one requires. The request body has to be rebuilt on every attempt. Building it once outside the loop works on the first level and breaks exactly on the level that exists to save you.
Service prices do not come from the bot
Cleaning, technical visits and maintenance do not get a price answered by the automated support. The request is forwarded to a person.
Why: the price of a service depends on roof access, height, distance and the condition of the equipment. A wrong number stated by a bot becomes a commercial commitment that someone will have to honor or take back.
Count taken in the repository on September 22, 2026.